Status of the Social Security and Medicare Programs
A SUMMARY OF THE 2019 ANNUAL REPORTS
Social Security and Medicare Boards of TrusteesEach year the Trustees of the Social Security and Medicare trust funds report on the current and projected financial status of the two programs. This message summarizes the 2019 Annual Reports.
Both Social Security and Medicare face long-term financing shortfalls under currently scheduled benefits and financing. Lawmakers have a broad continuum of policy options that would close or reduce the long-term financing shortfall of both programs. The Trustees recommend that lawmakers take action sooner rather than later to address these shortfalls, so that a broader range of solutions can be considered and more time will be available to phase in changes while giving the public adequate time to prepare. Earlier action will also help elected officials minimize adverse impacts on vulnerable populations, including lower-income workers and people already dependent on program benefits.
Social Security and Medicare together accounted for 45 percent of Federal program expenditures (excluding net interest on the debt) in fiscal year 2018. The unified budget reflects current trust fund operations. Consequently, even when there are positive trust fund balances, any drawdown of those balances, as well as general fund transfers into Medicare’s Supplementary Medical Insurance (SMI) fund and interest payments to the trust funds that are used to pay benefits, increase pressure on the unified budget. Both Social Security and Medicare will experience cost growth substantially in excess of GDP growth through the mid-2030s due to rapid population aging caused by the large baby-boom generation entering retirement and lower-birth-rate generations entering employment. For Medicare, it is also the case that growth in expenditures per beneficiary exceeds growth in per capita GDP over this time period. In later years, projected costs expressed as a share of GDP rise slowly for Medicare and are relatively flat for Social Security, reflecting very gradual population aging caused by increasing longevity and slower growth in per-beneficiary health care costs.
Social Security
The Social Security program provides workers and their families with retirement, disability, and survivors insurance benefits. Workers earn these benefits by paying into the system during their working years. Over the program’s 84-year history, it has collected roughly $21.9 trillion and paid out $19.0 trillion, leaving asset reserves of $2.9 trillion at the end of 2018 in its two trust funds.
The Old-Age and Survivors Insurance (OASI) Trust Fund, which pays retirement and survivors benefits, and the Disability Insurance (DI) Trust Fund, which pays disability benefits, are by law separate entities. However, to summarize overall Social Security finances, the Trustees have traditionally emphasized the financial status of the hypothetical combined OASI and DI Trust Funds. The combined funds—designated OASDI—satisfy the Trustees’ test of short-range (ten-year) financial adequacy because the Trustees project that the combined fund asset reserves at the beginning of each year will exceed that year’s projected cost throughout the short-range projection period. However, the funds fail the test of long-range close actuarial balance.
The Trustees project that the combined trust funds will be depleted in 2035, one year later than projected in last year’s report. The projected 75-year actuarial deficit for the OASDI trust funds is 2.78 percent of taxable payroll, down from 2.84 percent projected in last year’s report. This deficit amounts to 1.0 percent of GDP over the 75-year time period, or 21 percent of program non-interest income, or 17 percent of program cost. A 0.05 percentage point increase in the OASDI actuarial deficit would have been expected if nothing had changed other than the one-year shift in the valuation period from 2018 through 2092 to 2019 through 2093. The effects of updated demographic, economic, and programmatic data, and improved methodologies, collectively reduced the actuarial deficit by 0.11 percent of taxable payroll, more than offsetting the effect of changing the valuation period.
Considered separately, the DI Trust Fund reserves become depleted in 2052 and the OASI Trust Fund reserves become depleted in 2034. In last year’s report, the projected reserve depletion year was the same for OASI and 20 years earlier (2032) for DI. The change in the reserve depletion year for DI is largely due to continuing favorable experience for DI applications and benefit awards. Disability applications have been declining steadily since 2010, and the total number of disabled-worker beneficiaries in current payment status has been falling since 2014. Relative to last year’s Trustees Report, disability incidence rates are lower in 2018. They also are assumed to rise more gradually from the current levels to reach ultimate levels at the end of 10 years that are slightly lower. Accordingly, the projected Trust Fund depletion date is 20 years later and the 75-year actuarial deficit (0.12 percent of taxable payroll) is 0.09 percentage points lower than was projected last year. The depletion date change is large relative to the actuarial balance change because in last year’s report DI income was projected to be very near to DI cost for many years after the projected 2032 depletion date, so that a relatively small improvement in the program’s projected cash flow can have a large effect on the projected depletion date.
Social Security’s total cost is projected to exceed its total income (including interest) in 2020 for the first time since 1982, and to remain higher throughout the remainder of the projection period. Social Security’s cost will be financed with a combination of non-interest income, interest income, and net redemptions of trust fund asset reserves from the General Fund of the Treasury until 2035 when the OASDI reserves will become depleted. Thereafter, scheduled tax income is projected to be sufficient to pay about three-quarters of scheduled benefits through the end of the projection period in 2093. The ratio of reserves to one year’s projected cost (the combined trust fund ratio) peaked in 2008, generally declined through 2018, and is expected to decline steadily until the trust fund reserves are depleted in 2035.
Under current projections, the annual cost of Social Security benefits expressed as a share of workers’ taxable earnings will grow from 13.8 percent in 2018 to roughly 16.6 percent in 2040, and will then decline slightly before slowly increasing after 2051. Expressed as a share of GDP, program costs equaled 4.9 percent of GDP in 2018, and the Trustees project these costs will increase to 5.9 percent of GDP by 2039, decline to 5.8 percent of GDP by 2052, and thereafter generally rise slowly, reaching 6.0 percent by 2093.
Medicare
The Medicare program helps pay for health care services for the aged, disabled, and individuals with end-stage renal disease. It has two separate trust funds, the Hospital Insurance (HI) Trust Fund and the Supplementary Medical Insurance (SMI) Trust Fund. HI, otherwise known as Medicare Part A, helps pay for inpatient hospital services, skilled nursing facility and home health services following hospital stays, and hospice care. The SMI Trust Fund consists of separate accounts for Medicare Part B and Part D. Part B helps pay for physician, outpatient hospital, home health, and other services for individuals who have voluntarily enrolled. Part D provides subsidized access to drug insurance coverage on a voluntary basis for all beneficiaries, as well as premium and cost-sharing subsidies for low-income enrollees.
The Trustees project that the HI Trust Fund will be depleted in 2026, the same year projected in last year’s report. At that time dedicated revenues will be sufficient to pay 89 percent of HI costs. The Trustees project that the share of HI cost that can be financed with HI dedicated revenues will decline slowly to 77 percent in 2046, and will then rise gradually to 83 percent in 2093. The HI fund again fails the test of short-range financial adequacy, as its trust fund ratio is already below 100 percent of annual costs, and is expected to decline continuously until reserve depletion in 2026.
The HI Trust Fund’s projected 75-year actuarial deficit is 0.91 percent of taxable payroll, which represents 0.4 percent of GDP through 2093, or 23 percent of non-interest income, or 19 percent of program cost. This estimate is up from 0.82 percent of taxable payroll projected in last year’s report. Several factors contributed to the change in the actuarial deficit, most notably lower assumed productivity growth (+0.10 percent of taxable payroll), slower projected growth in the utilization of skilled nursing home facilities (-0.10 percent), higher costs and lower income in 2018 than expected (+0.04 percent), lower real discount rates (+0.03 percent), and other factors (+0.02 percent).
For SMI, the Trustees project that both Part B and Part D will remain adequately financed into the indefinite future because current law provides financing from general revenues and beneficiary premiums each year to meet the next year’s expected costs. However, the aging population and rising health care costs cause SMI projected costs to grow steadily from 2.1 percent of GDP in 2018 to approximately 3.7 percent of GDP in 2038, and to then increase more slowly to 4.2 percent of GDP by 2093. General revenues will finance roughly three-quarters of SMI costs, and premiums paid by beneficiaries almost all of the remaining quarter. SMI also receives a small amount of financing from special payments by States, and from fees on manufacturers and importers of brand-name prescription drugs.
The Trustees project that total Medicare costs (including both HI and SMI expenditures) will grow from approximately 3.7 percent of GDP in 2018 to 5.9 percent of GDP by 2038, and then increase gradually thereafter to about 6.5 percent of GDP by 2093.
Since 2008, national health expenditure (NHE) growth has been below historical averages, although it has generally continued to outpace growth of the economy. There is uncertainty regarding the degree to which this slowdown reflects the impacts of the most recent economic downturn and other non-persistent factors, as opposed to structural changes in the health care sector that may continue to produce cost savings in the years ahead. It is possible that U.S. health care practices are becoming more efficient as new payment models develop and providers anticipate less rapid growth of reimbursement rates in both the public and private sectors than has occurred during the past several decades.
For a number of years, the Trustees’ methodology for projecting Medicare finances over the long term has assumed a substantial reduction in per capita health expenditure growth rates relative to historical experience. In addition, since 2012 the Trustees have on balance revised down the projections for near-term Medicare expenditure growth in light of the recent favorable experience, which might in part be due to effects of payment changes and delivery system reform that are changing health care practices. The Trustees have not assumed additional long-term cost growth reductions arising from structural changes in the delivery system that may result from new payment mechanisms in the Medicare Access and CHIP Reauthorization Act of 2015 and the cost-reduction incentives in the Affordable Care Act, or from payment reforms initiated by the private sector.
Notwithstanding the assumption of a substantial slowdown of per capita health expenditure growth, the projections indicate that Medicare still faces a substantial financial shortfall that will need to be addressed with further legislation. Such legislation should be enacted sooner rather than later to minimize the impact on beneficiaries, providers, and taxpayers.
Conclusion
Lawmakers have many policy options that would reduce or eliminate the long-term financing shortfalls in Social Security and Medicare. Lawmakers should address these financial challenges as soon as possible. Taking action sooner rather than later will permit consideration of a broader range of solutions and provide more time to phase in changes so that the public has adequate time to prepare.
By the Trustees:Secretary of the Treasury,
and Managing Trustee
of the Trust Funds.
Alex M. Azar II,
Secretary of Health
and Human Services,
and Trustee.
Secretary of Labor,
and Trustee.
Nancy A.Berryhill,
Acting Commissioner of
Social Security,
and Trustee.
In 2018, Social Security’s reserves were $2.9 trillion at the year’s end, having increased by $3 billion. The Trustees project that under the intermediate assumptions, the Old-Age and Survivors Insurance (OASI) Trust Fund will be able to pay full benefits on a timely basis until 2034, unchanged from last year. The Disability Insurance (DI) Trust Fund is projected to be able to pay full benefits until 2052, 20 years later than indicated in last year’s Social Security report. Disabled-worker applications have continued to decline since 2010 and disability incidence rates have been well below expectations. Accordingly, the Trustees have reduced the long-range disability incidence rate assumption for this report. Lower numbers of disabled beneficiaries have caused the annual cost of the program to become much closer to annual income, making the DI Trust Fund reserve depletion date very sensitive to projected changes in program costs, leading to a large change in the depletion date. The projected depletion date for the combined OASI and DI funds is now 2035, one year later than in last year’s report.1 Over the 75-year projection period, Social Security faces an actuarial deficit of 2.78 percent of taxable payroll, decreased from the 2.84 percent figure projected last year. The actuarial deficit equals 1.0 percent of GDP through 2093.
Reserves in Medicare’s Hospital Insurance (HI) Trust Fund decreased by $2 billion to a total of $200 billion at the end of 2018. The Trustees project that the HI Trust Fund will be able to pay full benefits until 2026, unchanged from last year’s Medicare report. HI income is projected to be lower than last year’s estimates due to lower payroll taxes and reduced income from the taxation of Social Security benefits. HI expenditures are expected to be slightly higher than last year’s estimates because of higher- than-projected 2018 spending and higher projected provider updates. Provider payment rates are reduced by the growth in economy-wide productivity and the Trustees have assumed lower productivity growth in this year’s report. The HI actuarial deficit is 0.91 percent of taxable payroll over the 75-year projection period, 0.09 percentage point less favorable than projected in last year’s report, and equivalent to 0.4 percent of GDP through 2093. The Supplementary Medical Insurance (SMI) Trust Fund held $104 billion in assets at the end of 2018 and both parts (Part B and Part D) of SMI are expected to be adequately financed over the next 10 years and beyond because premium income and general revenue income are reset each year to cover expected costs and ensure an adequate reserve for Part B contingencies.
What Are the Trust Funds? Congress established trust funds managed by the Secretary of the Treasury to account for Social Security and Medicare income and disbursements. The Treasury credits Social Security and Medicare taxes, premiums, and other income to the funds. There are four separate trust funds. For Social Security, the OASI Trust Fund pays retirement and survivors benefits and the DI Trust Fund pays disability benefits. For Medicare, the HI Trust Fund pays for inpatient hospital and related care. The SMI Trust Fund comprises two separate accounts: Part B, which pays for physician and outpatient services, and Part D, which covers prescription drug benefits.
The only disbursements permitted from the funds are benefit payments and administrative expenses. Federal law requires that all excess funds be invested in interest-bearing securities backed by the full faith and credit of the United States. The Department of the Treasury currently invests all program revenues in special non-marketable securities of the U.S. Government which earn interest equal to rates on marketable securities with durations defined in law. The balances in the trust funds, which represent the accumulated value, including interest, of all prior program annual surpluses and deficits, provide automatic authority to pay benefits.
What Were the Trust Fund Operations in 2018 In 2018, 52.7 million people received OASI benefits, 10.2 million received DI benefits, and 59.9 million were covered under Medicare. A summary of the trust fund operations is shown below (Table 1). The DI and SMI Trust Fund reserves increased in 2018; OASI and HI Trust Fund reserves declined.
| OASI | DI | HI | SMI | |
|---|---|---|---|---|
| Reserves (end of 2017) | $2,820.3 | $71.5 | $202.0 | $87.7 |
| Income during 2018 | 831.0 | 172.3 | 306.6 | 449.1 |
| Cost during 2018 | 853.5 | 146.8 | 308.2 | 432.4 |
| Net change in Reserves | -22.4 | 25.6 | -1.6 | 16.7 |
| Reserves (end of 2018) | 2,797.9 | 97.1 | 200.4 | 104.3 |
Note: Totals do not necessarily equal the sum of rounded components.
Table 2 shows payments, by category, from each trust fund in 2018.
| Category (in billions) | OASI | DI | HI | SMI |
|---|---|---|---|---|
| Benefit payments | $844.9 | $143.7 | $303.0 | $427.7 |
| Railroad Retirement financial interchange | 4.8 | 0.2 | — | — |
| Administrative expenses | 3.8 | 2.9 | 5.2 | 4.7 |
| Total | 853.5 | 146.8 | 308.2 | 432.4 |
Note: Totals do not necessarily equal the sum of rounded components.
Trust fund income, by source, in 2018 is shown in Table 3.
| Source (in billions) | OASI | DI | HI | SMI |
|---|---|---|---|---|
| Payroll taxes | $715.9 | $169.2 | $268.3 | — |
| Taxes on OASDI benefits | 34.5 | 0.5 | 24.2 | — |
| Interest earnings | 80.7 | 2.6 | 7.1 | $2.6 |
| General Fund reimbursements | a | a | 1.6 | -6.6 |
| General revenues | — | — | — | $327.6 |
| Beneficiary premiums | — | — | 3.6 | 109.1 |
| Transfers from States | — | — | — | 11.7 |
| Other | a | — | 1.8 | 4.6 |
| Total | 831.0 | 172.3 | 306.6 | 449.1 |
Note: Totals do not necessarily equal the sum of rounded components.
a Less than $50 million.
In 2018, Social Security’s total income exceeded total cost by $3 billion, but when interest received on trust fund asset reserves is excluded from program income, there was a deficit of $80 billion. The Trustees now project that total cost will exceed total income (including interest) beginning in 2020 and thereafter.
In 2018, the HI Trust Fund’s total income ($307 billion), including $7 billion of interest income (Table 3), fell short of program expenditures ($308 billion). The Trustees project deficits in all years until reserves are depleted in 2026. For SMI, general revenues, which are set prospectively based on projected costs, are the largest source of income.
What Is the Outlook for Future Social Security and Medicare Costs in Relation to GDP? One instructive way to view the projected costs of Social Security and Medicare is to compare the costs of scheduled benefits and administrative expenses for the programs with the gross domestic product (GDP), the most frequently used measure of the total output of the U.S. economy (Chart A).
Under the intermediate assumptions employed in the reports, the costs of these programs as a percentage of GDP increase substantially through about 2035 because: (1) the number of beneficiaries rises rapidly as the baby-boom generation retires; and (2) the lower birth rates that have persisted since the baby boom cause slower growth of employment and GDP.
Social Security’s annual cost as a percentage of GDP is projected to increase from 4.9 percent in 2019 to about 5.9 percent by 2039, then decline to 5.8 percent by 2052 before generally rising to 6.0 percent of GDP by 2093. Under the intermediate assumptions, Medicare cost rises from 3.7 percent of GDP in 2019 to 5.7 percent of GDP by 2035 due mainly to the growth in the number of beneficiaries, and then increases further to 6.5 percent by 2093. The growth in health care cost per beneficiary becomes the larger factor later in the valuation period, particularly in Part D.
Chart A—Social Security and Medicare Cost as a Percentage of GDP
In 2019, the combined cost of the Social Security and Medicare programs is estimated to equal 8.7 percent of GDP. The Trustees project an increase to 11.6 percent of GDP by 2035 and to 12.5 percent by 2093, with most of the increases attributable to Medicare. Medicare’s annual relative cost is expected to rise gradually from 76 percent of the cost of Social Security in 2019 to become the more costly program by 2040. During the last 35 years of the long-range period, Medicare is 5 to 7 percent more costly than Social Security.
The projected costs for OASDI and HI depicted in Chart A and elsewhere in this summary reflect the full cost of scheduled current-law benefits without regard to whether the trust funds will have sufficient resources to meet these obligations. Current law precludes payment of any benefits beyond the amount that can be financed by each of the trust funds, that is, from annual income and trust fund reserves. In years after trust fund reserve depletion, the amount of benefits that would be payable is lower than shown because OASI, DI, and HI, by law, cannot borrow money or pay benefits that exceed the asset reserves in their trust funds. The projected costs assume realization of the full estimated savings of the Affordable Care Act and the physician payment rate updates specified in the Medicare Access and CHIP Reauthorization Act (MACRA) of 2015. As described in the Medicare Trustees Report, the projections for HI and SMI Part B depend significantly on the sustained effectiveness of various current-law cost-saving measures, in particular, the lower increases in Medicare payment rates to most categories of health care providers.
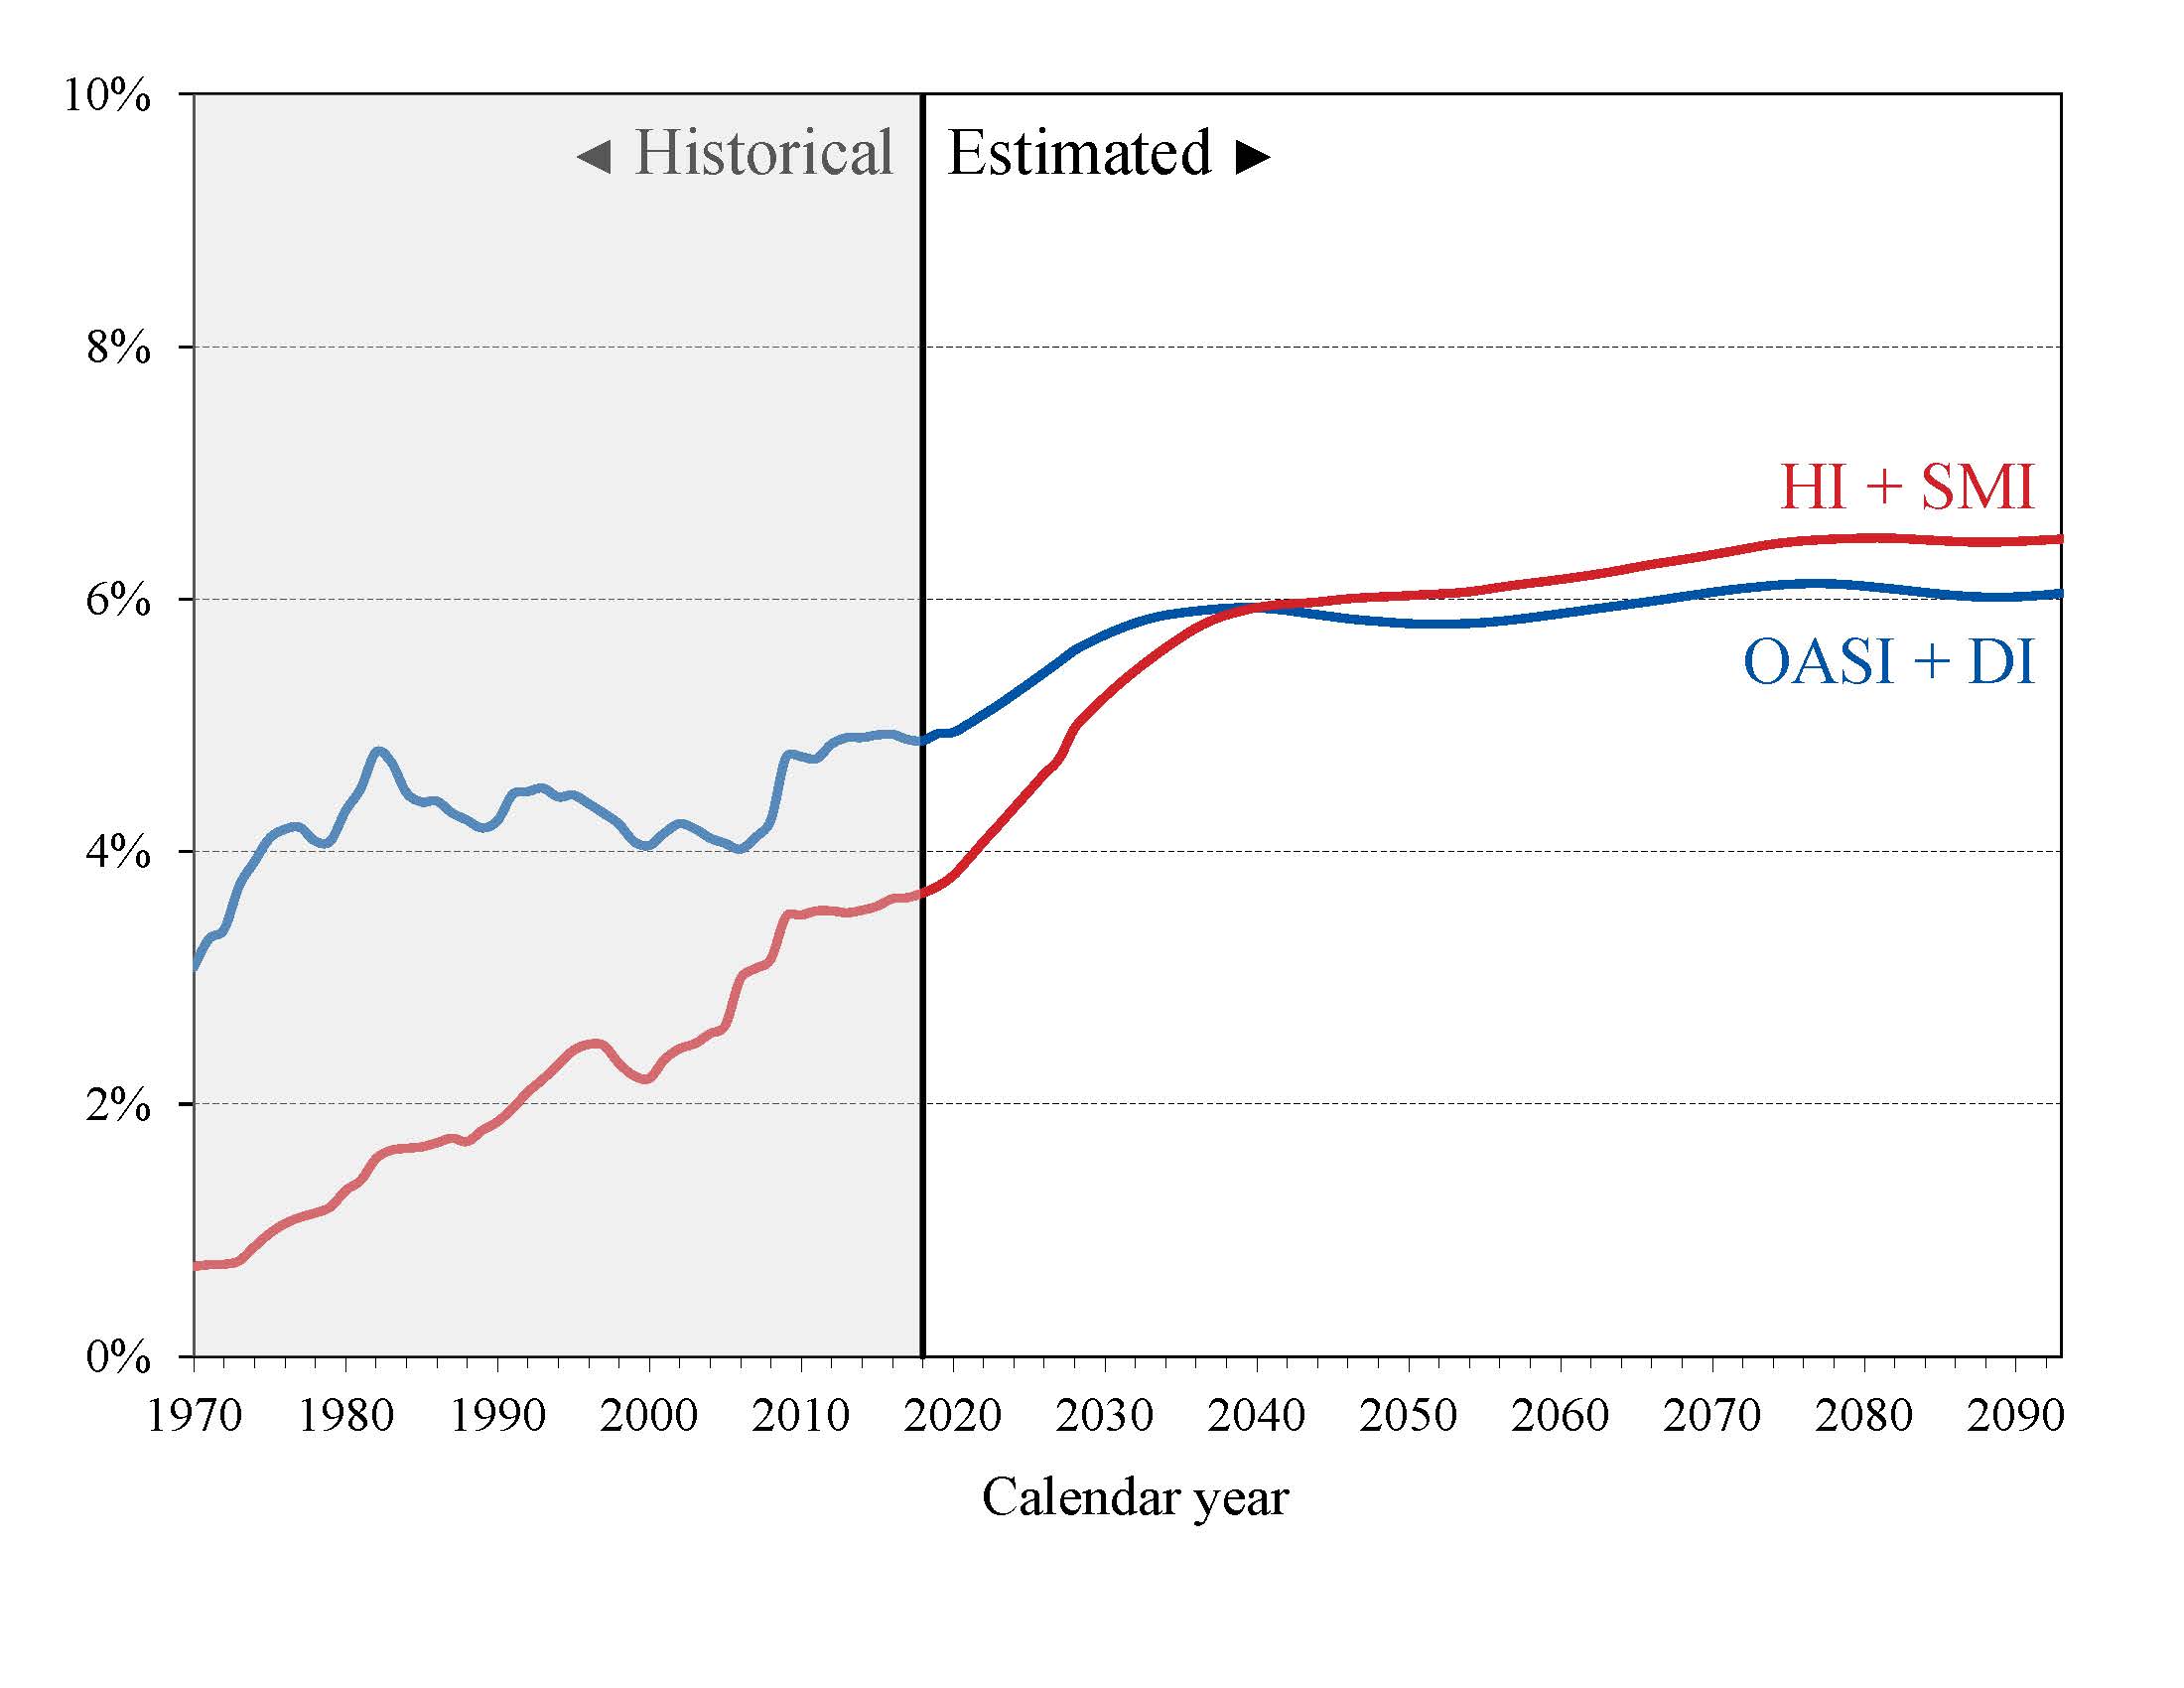
What is the Outlook for Future Social Security and Medicare HI Costs and Income in Relation to Taxable Earnings? Because the primary source of income for OASDI and HI is the payroll tax, it is informative to express the programs’ incomes and costs as percentages of taxable payroll—that is, of the base of worker earnings taxed to support each program (Chart B).
Chart B—OASDI and HI Income and Cost as Percentages
of Their Respective Taxable Payrolls
It is important to understand that the two programs have different taxable payrolls. HI taxable payroll is about 25 percent larger than that of OASDI because the HI payroll tax is imposed on all covered earnings while OASDI taxes apply only to earnings up to a maximum ($132,900 in 2019), which ordinarily is adjusted each year. Thus, the percentages in Chart B are comparable within each program, but not across programs.
Both the OASDI and HI annual cost rates rise over the long run from their 2018 levels (13.77 and 3.44 percent). Projected Social Security cost grows to 16.62 percent of taxable payroll in 2040 and to 17.47 percent of taxable payroll in 2093. The projected Medicare HI cost rate rises to 5.00 percent of taxable payroll in 2046, and thereafter increases to 5.32 percent in 2093.
The OASDI and HI income rates in Chart B include payroll taxes and taxes on OASDI benefits, but not interest payments. The projected OASDI income rate is stable at about 13 percent throughout the long-range period. The HI income rate rises gradually from 3.33 percent in 2018 to 4.42 percent in 2093 due to the higher payroll tax rates for high earners that began in 2013. Individual tax return filers with earnings above $200,000, and joint return filers with earnings above $250,000, pay an additional 0.9 percent tax on earnings above these earnings thresholds. An increasing fraction of all earnings will be subject to the higher tax rate over time because the thresholds are not indexed. By 2093, an estimated 79 percent of workers would pay the higher rate.
How Will Cost Growth in the Different Parts of Medicare Change the Sources of Program Financing? As Medicare cost grows over time, general revenues and beneficiary premiums will play an increasing role in financing the program. Chart C shows scheduled cost and non-interest revenue sources under current law for HI and SMI combined as a percentage of GDP. The total cost line is the same as displayed in Chart A and shows Medicare cost rising to 6.5 percent of GDP by 2093
Chart C—Medicare Cost and Non-Interest Income by Source as a Percentage of GDP
Projected revenue from payroll taxes and taxes on OASDI benefits credited to the HI Trust Fund increases from 1.4 percent of GDP in 2019 to 1.9 percent in 2093 under current law, while projected general revenue transfers to the SMI Trust Fund increase from 1.6 percent of GDP in 2019 to 3.0 percent in 2093, and beneficiary premiums increase from 0.6 to 1.1 percent of GDP during the same period. Thus, the share of total non-interest Medicare income from taxes declines (from 40 percent to 31 percent) while the general revenue share rises (from 43 percent to 49 percent), as does the share of premiums (from 15 percent to 18 percent). The distribution of financing changes in large part because costs for Part B and especially Part D—the Medicare components that are financed mainly from general revenues—increase at a faster rate than Part A cost under the Trustees’ projections. The projected annual HI financial deficit beyond 2035 through 2093 averages about 0.4 percent of GDP and there is no provision under current law to finance that shortfall through general revenue transfers or any other revenue source.
The Medicare Modernization Act of 2003 (MMA) requires that the Board of Trustees determine each year whether the annual difference between program cost and dedicated revenues (the bottom four layers of Chart C) under current law exceeds 45 percent of total Medicare cost in any of the first seven fiscal years of the 75-year projection period. The Trustees Reports for 2006 through 2013, and in 2017 and 2018, contained a determination of “excess general revenue Medicare funding.” Because the current projected difference is expected to exceed the 45 percent threshold in fiscal year 2021, the Trustees are issuing a determination of projected excess general revenue Medicare funding in this year’s report. Since this determination has been made for two consecutive years, a “Medicare funding warning” is triggered, which requires that the President submit to Congress proposed legislation to respond to the warning within 15 days after the submission of the Fiscal Year 2021 Budget. Congress is then required to consider the legislation on an expedited basis.
What are the Budgetary Implications of Rising Social Security and Medicare Costs? Discussion of the long-range financial outlook for Medicare and Social Security often focuses on the reserve depletion dates for the HI and combined OASDI trust funds—the times when the projected trust fund asset reserves under current law will be insufficient to pay the full amounts of scheduled benefits. Normal operations of the trust funds also have an impact on the unified Federal budget.
Under the OASDI and HI programs, when taxes and other sources of revenue are collected in excess of immediate program costs, the excess is invested in Treasury bonds and held in reserve for future periods. Accumulation of asset reserves in the trust funds improves the unified Federal budget position. When trust fund reserves are drawn down to pay scheduled benefits, bonds are redeemed and interest payments are made, creating a current-year cost to the unified Federal budget.
SMI differs fundamentally from HI and OASDI in regard to the nature of its financing and the method by which its financial status is evaluated. Unlike HI and OASDI, SMI does not have a trust fund structure with surpluses accumulated from prior years. General revenues finance roughly 75 percent of all SMI costs and pose an immediate cost for the unified Federal budget.
Chart D shows the required SMI general revenue funding, plus the excess of scheduled costs over dedicated tax and premium income for the OASDI and HI trust funds expressed as percentages of GDP through 2043. For OASDI and HI, the difference between scheduled cost and dedicated revenues is equal to interest earnings and asset redemptions prior to trust fund depletion, and unfunded obligations after depletion. The chart assumes full benefits will be paid after trust fund depletion, even though under current law expenditures can only be made to the extent covered by current income. Such budgetary assumptions are typical of unified budget baselines, but do not reflect current law in the Social Security Act.
Chart D—Projected SMI General Revenue Funding
plus OASDI and HI Tax Shorfalls
[Percentage of GDP]
In 2019, the projected difference between Social Security’s expenditures and non-interest income is $81 billion. The Trustees anticipate a deficit of $13 billion in non-interest income for the HI program.2 The projected general revenue demands of SMI are $337 billion. Thus, the total general revenue requirements for Social Security and Medicare in 2019 are $431 billion, or 2.0 percent of GDP. Redemption of trust fund bonds, interest paid on those bonds, and general revenue transfers provide no new net income to the Treasury. When the unified budget is not in surplus, these payments are made through some combination of increased taxation, reductions in other government spending, or additional borrowing from the public.
Each of these trust funds’ operations will contribute increasing amounts to Federal unified budget deficits in future years as trust fund bonds are redeemed. Until 2026, interest earnings and asset redemptions, financed from general revenues, will cover the excess of HI expenditures over tax and premium revenues. In addition, general revenues must cover similar payments as a result of growing OASDI bond redemption and interest payments through 2035 as the trust funds are drawn down.
Without a change in law, the OASI, DI, and HI Trust Funds do not have borrowing authority and after depletion of reserves would be unable to pay scheduled benefits in full on a timely basis. However, if full benefits were to be maintained for both Social Security and Medicare, by 2043 the combined OASDI and HI financing gap plus SMI’s projected general revenue demands would equal 4.4 percent of GDP—more than double the 2019 share.
What Is the Outlook for Short-Term Trust Fund Adequacy? The reports measure the short-range adequacy of the OASI, DI, and HI Trust Funds by comparing fund asset reserves at the start of a year to projected costs for the ensuing year (the “trust fund ratio”). A trust fund ratio of 100 percent or more—that is, asset reserves at least equal to projected cost for the year—is a good indicator of a fund’s short-range adequacy. That level of projected reserves for any year suggests that even if cost exceeds income, the trust fund reserves, combined with annual tax revenues, would be sufficient to pay full benefits for several years. Chart E shows the trust fund ratios through 2055 under the intermediate assumptions.
By this measure, the OASI Trust Fund is financially adequate throughout the short-range period (2019-28). The DI Trust Fund fails the short-range test because its trust fund ratio was 65 percent at the beginning of 2019 and is not projected to reach 100 percent within 5 years.
The HI Trust Fund does not meet the short-range test of financial adequacy; its trust fund ratio was 61 percent at the beginning of 2019 based on the year’s anticipated expenditures, and the projected ratio does not rise to 100 percent within 5 years. Projected HI Trust Fund asset reserves become fully depleted in 2026.
Chart E—OASI, DI, and HI Trust Fund Ratios
[Asset reserves as a percentage of annual cost]
The Trustees apply a less stringent annual “contingency reserve” test to SMI Part B asset reserves because (i) the financing for that account is set each year to meet expected costs, and (ii) the overwhelming portion of the financing for that account consists of general revenue transfers and beneficiary premiums, which were 72 percent and 26 percent of total Part B income in calendar year 2018. Part D premiums paid by enrollees and the required amount of general revenue financing are determined each year. Moreover, flexible appropriation authority established by lawmakers for Part D allows additional general revenue transfers if costs are higher than anticipated, limiting the need for a contingency reserve in that account.
What Are Key Dates in OASI, DI, and HI Financing? The 2019 reports project that the OASI and HI Trust Funds will be depleted within 16 years; the anticipated depletion year for the DI Trust Fund is now 2052. Table 4 shows key dates for the respective trust funds as well as for the combined OASDI trust funds. 3
| OASI | DI | OASDI | HI | |
|---|---|---|---|---|
| First year cost exceeds income excluding interesta | 2010 | 2036 | 2010 | 2008 |
| First year cost exceeds total incomea | 2020 | 2041 | 2020 | 2018 |
| Year trust funds are depleted | 2034 | 2052 | 2035 | 2026 |
a Dates indicate the first year a condition is projected to occur and to persist annually thereafter through 2090.
The Trustees project that DI Trust Fund reserves will decrease in 2019 and 2020, and then increase through 2040 before declining annually until they are fully depleted in 2052. At that time, program income would be sufficient to pay 91 percent of scheduled benefits.
The OASI Trust Fund, when considered separately, has a projected reserve depletion date of 2034, unchanged from last year’s report. At that time, 77 percent of scheduled OASI benefits would be payable.
The combined OASI and DI Trust Fund reserves now have a projected depletion date of 2035, one year later than in last year’s report. After the depletion of reserves, continuing tax income would be sufficient to pay 80 percent of scheduled benefits in 2035, declining to 75 percent in 2093.
The combined OASI and DI Trust Fund reserves are projected to increase in 2019 because expected total income ($1,061 billion) slightly exceeds anticipated total cost ($1,060 billion). Beginning in 2020, annual total OASDI cost exceeds income by increasing amounts throughout the 75-year projection. Thus, beginning in 2020, net redemptions of trust fund asset reserves with General Fund payments will be required to pay scheduled benefits until projected depletion of these reserves in 2035, one year later than in last year’s report.
The projected HI Trust Fund depletion date is 2026, the same year as reported last year. Under current law, scheduled HI tax and premium income would be sufficient to pay 89 percent of estimated HI cost after trust fund depletion in 2026, declining to 78 percent by 2043, and then gradually increasing to 83 percent again by 2093.
This report projects a decrease in HI Trust Fund asset reserves in 2019 as total cost ($330 billion) is expected to exceed total income ($324 billion). Projected annual HI cost exceeds program income throughout the long-range projection period and assets will decline continuously until depletion of all reserves in 2026.
What is the Long-Range Actuarial Balance of the OASI, DI, and HI Trust Funds? Another way to view the outlook for payroll tax-financed trust funds (OASI, DI, and HI) is to consider their actuarial balances for the 75-year valuation period. The actuarial balance measure includes the trust fund asset reserves at the beginning of the period, an ending fund balance equal to the 76th year’s costs, and projected costs and income during the valuation period, all expressed as a percentage of taxable payroll for the 75-year projection period. Actuarial balance is not an informative concept for the SMI program because Federal law sets premium increases and general revenue transfers at the levels necessary to bring SMI into annual balance.
The actuarial deficit represents the average amount of change in income or cost that is needed throughout the valuation period in order to achieve actuarial balance. The actuarial balance equals zero if cost for the period can be met for the period as a whole and trust fund asset reserves at the end of the period are equal to the following year’s cost. The OASI, DI, and HI Trust Funds all have long-range actuarial deficits under the intermediate assumptions, as shown in the following table.
| OASI | DI | OASDI | HI | |
|---|---|---|---|---|
| Actuarial deficit | 2.67 | 0.12 | 2.78 | 0.91 |
NOTE: Totals do not necessarily equal the sums of rounded components.
The annual deficit, expressed as the difference between the cost rate and income rate for a particular year, for the combined OASI and DI Trust Funds was 1.10 percent of taxable payroll in 2018. The Trustees project that the annual deficits for Social Security will be smaller throughout the 75-year valuation period than reported last year. Annual deficits for 2019-93 average 0.18 percentage point lower than in last year’s report. Projected annual deficits gradually increase from 1.06 percent of taxable payroll in 2019 to 3.34 percent in 2040. The deficits then decline gradually to 3.09 percent in 2051 before resuming a generally upward trajectory and reaching 4.11 percent of taxable payroll in 2093 (Chart B). The relatively large variation in annual deficits indicates that a single tax rate increase for all years starting in 2019 sufficient to achieve actuarial balance would result in sizable annual surpluses early in the period followed by increasing deficits in later years. Sustainable solvency would require payroll tax rate increases or benefit reductions (or a combination thereof) by the end of the period that are substantially larger than those needed on average for this report’s long-range period (2019-93).
In 2018, the HI annual deficit was 0.11 percent of taxable payroll, continuing its downward trend since 2010, but is expected to rise to 0.12 percent in 2019. Projected annual deficits then gradually increase to 1.13 percent of taxable payroll by 2046, before generally declining to 0.91 in 2093. The HI cost rate has mostly been declining since 2010 mainly due to (i) expenditure growth that was constrained in part by low utilization and low payment updates and (ii) a rebound of taxable payroll growth from 2007-09 recession levels. Starting in 2019, the cost rate is expected to rise primarily due to the continued retirements of those in the baby boom generation and partly due to an expected return to modest health services cost growth. This cost-rate increase is moderated by the accumulating effect of the productivity adjustments to provider price updates, which are estimated to reduce annual HI per capita cost growth by an average of 0.8 percent through 2028 and 1.0 percent thereafter. After 25, 50, and 75 years, for example, the prices paid to HI providers under current law would be 20 percent, 38 percent, and 52 percent lower, respectively, than prices absent the productivity reductions.
The financial outlooks for both OASDI and HI depend on a number of demographic and economic assumptions. Nevertheless, the actuarial deficit in each of these programs is large enough that averting trust fund depletion under current-law financing is extremely unlikely. An analysis that allows plausible random variations around the intermediate assumptions employed in the report indicates that OASDI trust fund depletion is highly probable by mid-century.
How Has the Financial Outlook for Social Security and Medicare Changed Since Last Year? Under the intermediate assumptions, the combined OASDI trust funds have a projected 75-year actuarial deficit equal to 2.78 percent of taxable payroll, compared with the 2.84 percent figure reported last year. The projected depletion date for the combined asset reserves is 2035, one year later than in last year’s report. Advancing the valuation date by one year to include 2093, a year with a large negative balance, alone would have increased the actuarial deficit by 0.05 percent of taxable payroll. That effect was more than fully offset by changes in law, assumptions, and methods that collectively decreased the actuarial deficit by 0.11 percent of taxable payroll.
The long-range actuarial deficit for the DI Trust Fund is now 0.12 percent of taxable payroll, down from 0.21 percent projected in last year’s report. Since 2010, disability applications have been declining and the number of disabled-worker beneficiaries has been falling since 2014. In light of this experience, and in consideration of long-term averages, in this report the Trustees have lowered the ultimate age-sex-adjusted disability incidence rate assumption from 5.4 to 5.2 per thousand exposed.
Medicare’s HI Trust Fund has a long-range actuarial deficit equal to 0.91 percent of taxable payroll under the intermediate assumptions, 0.09 percentage point larger than reported last year. The anticipated date of depletion of the HI Trust Fund remains 2026. HI income is projected to be lower than last year’s estimates due to lower payroll tax revenue and reduced income from the taxation of Social Security benefits. In addition, HI expenditures are expected to be slightly higher than last year’s estimates throughout the short-range period because of higher-than-projected 2018 spending and higher projected provider payment updates.
Due to the nature of the financing for both parts of SMI, each account is separately in financial balance under current law, as they were last year. Projected Part B costs are higher than those in last year’s report due to faster expected spending growth for physician-administered drugs and lower economy-wide productivity assumptions. In contrast, anticipated Part D spending is lower than in last year’s report because of higher rebates and slower overall drug price increases. SMI spending was 2.1 percent of GDP in 2018, and is now expected to increase to 4.2 percent of GDP in 2092. In last year’s report, SMI spending was estimated to be 3.9 percent of GDP in 2092.
How Are Social Security and Medicare Financed? For OASDI and HI, the major source of financing is payroll taxes on earnings paid by employees and their employers. Self-employed workers pay the equivalent of the combined employer and employee tax rates. During 2018, an estimated 176.0 million people had earnings covered by Social Security and paid payroll taxes; for Medicare the corresponding figure was 180.0 million. Current law establishes payroll tax rates for OASDI, which apply to earnings up to an annual maximum ($132,900 in 2019) that ordinarily increases with the growth in the nationwide average wage. In contrast to OASDI, covered workers pay HI taxes on total earnings. The scheduled payroll tax rates (in percent) for 2019 are:
| OASI | DI | OASDI | HI | Total | |
|---|---|---|---|---|---|
| Employees | 5.30 | 0.90 | 6.20 | 1.45 | 7.65 |
| Employers | 5.30 | 0.90 | 6.20 | 1.45 | 7.65 |
| Combined total | 10.60 | 1.80 | 12.40 | 2.90 | 15.30 |
There is an additional HI tax equal to 0.9 percent of earnings over $200,000 for individual tax return filers, and on earnings over $250,000 for joint return filers.
Taxation of Social Security benefits is another source of income for the Social Security and Medicare trust funds. Beneficiaries with incomes above $25,000 for individuals (or $32,000 for married couples filing jointly) pay income taxes on up to 50 percent of their benefits, with the revenues going to the OASDI trust funds. This income from taxation of benefits made up about 3 percent of Social Security’s income in 2018. Those with incomes above $34,000 (or $44,000 for married couples filing jointly) pay income taxes on up to 85 percent of benefits, with the additional revenues going to the Medicare trust fund. This income from taxation of benefits made up about 8 percent of HI Trust Fund income in 2018.
The trust funds also receive income from interest on their accumulated reserves, which are invested in U.S. Government securities. In 2018, interest income made up 8 percent of total income to the OASDI trust funds, 2 percent for HI, and less than 1 percent for SMI.
Payments from the General Fund financed about 74 percent of SMI Part B and Part D costs in 2018, with most of the remaining costs covered by monthly premiums charged to enrollees or in the case of low-income beneficiaries, paid on their behalf by Medicaid for Part B and Medicare for Part D. Part B and Part D premium amounts are determined by methods defined in law and increase as the estimated costs of those programs rise.
In 2019, the Part B standard monthly premium is $135.50. There are also income-related premium surcharges for Part B beneficiaries whose modified adjusted gross income exceeds a specified threshold. In 2019, the threshold is $85,000 for individual tax return filers and $170,000 for joint return filers. Income-related premiums range from $189.60 to $460.50 per month in 2019.
In 2019, the Part D “base monthly premium” is $33.19. Actual premium amounts charged to Part D beneficiaries depend on the specific plan they have selected and average around $32 for standard coverage. Part D enrollees with incomes exceeding the thresholds established for Part B must pay income-related monthly adjustment amounts in addition to their normal plan premium. For 2019, the adjustments range from $12.40 to $77.40 per month. Part D also receives payments from States that partially compensate for the Federal assumption of Medicaid responsibilities for prescription drug costs for individuals eligible for both Medicare and Medicaid. In 2019, State payments cover about 12 percent of Part D costs.
Who Are the Trustees? There are six Trustees, four of whom serve by virtue of their positions in the Federal Government: the Secretary of the Treasury, the Secretary of Labor, the Secretary of Health and Human Services, and the Commissioner of Social Security. The other two Trustees are public representatives appointed by the President, subject to confirmation by the Senate. The two Public Trustee positions have been vacant since July 2015.
2 This difference is projected on a cash rather than the incurred expenditures basis applied elsewhere in the long-range projections, except where explicitly noted otherwise.
3 HI results in this section of the Summary are on a cash rather than the incurred expenditures basis
A MESSAGE FROM THE PUBLIC TRUSTEES
Because the two Public Trustee positions are currently vacant, there is no Message from the Public Trustees for inclusion in the Summary of the 2019 Annual Reports.