Congressional Statistics: Disability Insurance for December 2014
Florida
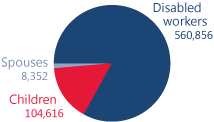
Most DI beneficiaries in Florida are disabled workers

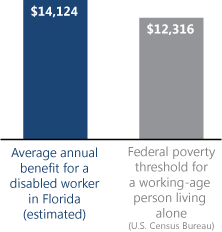
Average annual benefits compared to the poverty threshold

Total annual benefits

$8.4 billion
(estimated)
While Social Security is best known for providing retirement benefits, the program also provides Disability Insurance (DI) protection to workers and their families (spouses, minor children, and disabled adult children).
| Congressional district | Number of beneficiaries | Average monthly benefit (dollars) | Total monthly benefits (millions of dollars) | |||||
|---|---|---|---|---|---|---|---|---|
| Total | Disabled workers | Children | Spouses | Disabled workers | Children | Spouses | ||
| Florida | 673,824 | 560,856 | 104,616 | 8,352 | 1,177 | 354 | 312 | 699.9 |
| 1 | 31,019 | 25,692 | 4,831 | 496 | 1,144 | 334 | 304 | 31.2 |
| 2 | 27,038 | 22,553 | 4,172 | 313 | 1,113 | 326 | 296 | 26.6 |
| 3 | 27,429 | 22,725 | 4,303 | 401 | 1,170 | 352 | 300 | 28.2 |
| 4 | 22,294 | 18,784 | 3,293 | 217 | 1,221 | 393 | 330 | 24.3 |
| 5 | 35,459 | 29,487 | 5,650 | 322 | 1,057 | 287 | 285 | 32.9 |
| 6 | 29,784 | 25,294 | 4,095 | 395 | 1,223 | 388 | 314 | 32.6 |
| 7 | 21,579 | 17,408 | 3,814 | 357 | 1,226 | 371 | 319 | 22.9 |
| 8 | 30,925 | 25,939 | 4,573 | 413 | 1,238 | 381 | 310 | 34.0 |
| 9 | 31,857 | 24,358 | 6,914 | 585 | 1,150 | 333 | 299 | 30.5 |
| 10 | 25,827 | 21,225 | 4,267 | 335 | 1,201 | 357 | 328 | 27.1 |
| 11 | 38,243 | 32,014 | 5,614 | 615 | 1,220 | 359 | 308 | 41.2 |
| 12 | 31,471 | 26,101 | 5,004 | 366 | 1,233 | 382 | 302 | 34.2 |
| 13 | 28,391 | 25,056 | 3,142 | 193 | 1,189 | 375 | 320 | 31.0 |
| 14 | 32,192 | 26,957 | 4,937 | 298 | 1,068 | 308 | 297 | 30.4 |
| 15 | 26,660 | 21,805 | 4,583 | 272 | 1,183 | 355 | 322 | 27.5 |
| 16 | 23,862 | 20,335 | 3,254 | 273 | 1,256 | 393 | 347 | 26.9 |
| 17 | 30,750 | 25,759 | 4,619 | 372 | 1,211 | 349 | 301 | 32.9 |
| 18 | 22,970 | 19,072 | 3,630 | 268 | 1,283 | 403 | 332 | 26.0 |
| 19 | 21,233 | 17,817 | 3,117 | 299 | 1,289 | 386 | 337 | 24.3 |
| 20 | 24,072 | 19,809 | 4,044 | 219 | 1,091 | 302 | 284 | 22.9 |
| 21 | 15,582 | 12,733 | 2,637 | 212 | 1,327 | 437 | 325 | 18.1 |
| 22 | 16,213 | 14,256 | 1,821 | 136 | 1,274 | 409 | 338 | 19.0 |
| 23 | 14,268 | 12,091 | 1,981 | 196 | 1,210 | 415 | 337 | 15.5 |
| 24 | 21,834 | 17,998 | 3,621 | 215 | 1,018 | 284 | 293 | 19.4 |
| 25 | 13,569 | 11,302 | 2,061 | 206 | 1,087 | 363 | 316 | 13.1 |
| 26 | 14,987 | 12,250 | 2,545 | 192 | 1,113 | 347 | 327 | 14.6 |
| 27 | 14,316 | 12,036 | 2,094 | 186 | 989 | 310 | 302 | 12.6 |
| All areas a | 10,931,092 | 8,954,518 | 1,827,619 | 148,955 | 1,165 | 349 | 315 | 11,120.2 |
| SOURCES: Social Security Administration, Master Beneficiary Record, 100 percent data; and U.S. Postal Service geographic data. | ||||||||
| a. Includes beneficiaries in the 50 states, District of Columbia, American Samoa, Guam, Northern Mariana Islands, Puerto Rico, U.S. Virgin Islands, and foreign countries. | ||||||||